en
Light
Dark
Get consultation

The magic of
Power BI

hero image
Unlock the potential of data
Power BI is used in over 200 countries, helping companies optimize decision-making.
Demand for Power BI specialists has grown 2.5 times over the past two years
A leader in analytics and business intelligence. Power BI is ahead of the competition in terms of execution capability and product vision
More than 97% of Fortune 500 companies use Power BI for data analysis and visualization
Register
Start:
18.04.24
Format:
online
Duration:
2 months
hero image

Course overview:

Master the tool for business analysis and creation of interactive reports

icon

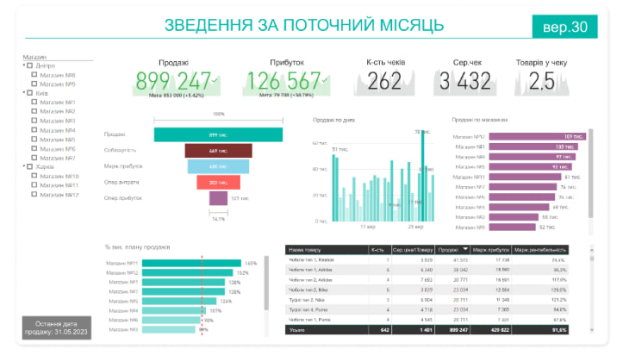
You can build graphs and dashboards to evaluate metrics without programmers.

icon

You can create a system of end-to-end analytics to solve business problems effectively.

icon

You will always be aware of company statistics.

review

Advantages of the course

work
Required specialty
According to the LinkedIn Workforce Report, the demand for Power BI professionals has increased by 25% over the past two years. Our course will open the door to various analytics and business intelligence career opportunities.
AI not take your place
Effective work
According to Gartner research, using Power BI can reduce the time for data analysis by 60%! Take the Power BI course and start working efficiently with large volumes of data, quickly highlighting key information.
HR training
Specific Skills
A new professional-level
The course provides students in-depth knowledge of Power BI, from basics to advanced capabilities. This allows you to use the platform in work tasks effectively.

Our course is suitable for:

man
icon
Managers
To quickly create reports reflecting the company’s statistics, build a system of end-to-end analytics, and track key business indicators without the involvement of other specialists.
man
icon
Analysts
To increase your Power BI skills, download and synchronize data from different sources to improve your Power BI skills. Learn to build visual and interactive graphs and dashboards.
woman
icon
Financiers
Organize management accounting with business indicators. You no longer need to look at dozens of Excel tables and wait for analysts' and developer’s responses.
man
icon
Business owners
The course will help business owners implement an analytics system based on Power BI in their company. This will significantly improve the efficiency of your business
man
icon
BI to developers
The Power BI course provides an opportunity to deepen knowledge of working with the platform, develop data visualization skills, and effectively implement analytical solutions.
man
icon
Data analysts
It will help analysts increase their skills in working with Power BI to obtain valuable information and create reports that support informed decisions.
man
icon
Data to scientists
The course will expand your knowledge of working with various data sources and teach you how to use Power BI to analyze and visualize large amounts of information.
man
icon
Business analysts
They will be able to optimize data processes, build effective models, and create reports that will help understand key aspects of the business.
woman
icon
Project managers
Project managers will gain knowledge to conveniently monitor and analyze project progress, which will facilitate strategic decision-making.
woman
icon
Marketers
Marketers will be able to effectively visualize data from advertising campaigns, track conversions, and analyze the results of marketing strategies.
woman
icon
For finance specialists
Finance specialists will have the opportunity to organize management accounting and effectively analyze financial indicators independently.
man
icon
IT specialists
IT professionals learn to implement Power BI in a corporate environment, ensuring reliable and efficient data storage and processing.
man
icon
For startups and entrepreneurs
They will receive a tool for creating analytical reports that will help improve strategy and make informed decisions.
woman
icon
To students
Students and academics will have the opportunity to expand their data analysis and visualization skills, preparing for future challenges in their fields.
Register

Course program

Module 1
Basics of BI analytics
icon
Basics of BI analytics
Module 1
Introduction to BI and Power BI
Quick start with Power BI: Building your first dashboard
Module 2
Mastery of working with data in Power BI
icon
Mastery of working with data in Power BI
Module 2
Data Connections and Transformations in Power Query – Part 1
Data Transformation in Power Query – Part 2
Data modeling in Power BI
Module 3
Virtuoso visualization in Power BI
icon
Virtuoso visualization in Power BI
Module 3
Advanced visualization and custom elements
Advanced visualizations and interactivity in Power BI
Advanced visualization and custom elements
Module 4
DAX is the data language in Power BI
icon
DAX is the data language in Power BI
Module 4
DAX Basics for Power BI
The CALCULATE function and its application
Working with time series in
DAX Tables from DAX
Module 5
Advanced Power BI Service capabilities and customizations
icon
Advanced Power BI Service capabilities and customizations
Module 5
Familiarity with Power BI Service and its components
Dataflow, Power BI Premium, and Embedded reports
Tabular Editor for Power BI
Version control system for Power BI

Bonus activity: An overview of Microsoft’s new Fabric feature

icon
Basics of BI analytics
Module 1
Introduction to BI and Power BI
Quick start with Power BI: Building your first dashboard
icon
Mastery of working with data in Power BI
Module 2
Data Connections and Transformations in Power Query – Part 1
Data Transformation in Power Query – Part 2
Data modeling in Power BI
icon
Virtuoso visualization in Power BI
Module 3
Advanced visualization and custom elements
Advanced visualizations and interactivity in Power BI
Advanced visualization and custom elements
icon
DAX is the data language in Power BI
Module 4
DAX Basics for Power BI
The CALCULATE function and its application
Working with time series in
DAX Tables from DAX
icon
Advanced Power BI Service capabilities and customizations
Module 5
Familiarity with Power BI Service and its components
Dataflow, Power BI Premium, and Embedded reports
Tabular Editor for Power BI
Version control system for Power BI

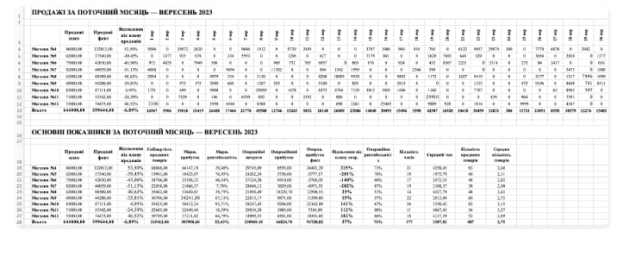
Your reports before/after the course

Report before the course
table

Report after the course

table

The training program has the following features:

Wi-fi
Online Format
Each lesson is conducted in an online format on the platform using real-cases
practice
Emphasis on practice
The course is based on practice and interaction with experienced mentors.
mentor
Professional mentors
Exclusive learning experiences from individuals with a wealth of expertise, who understand their field and are prepared to provide assistance.
specialist
video
Record classes
Each lesson is recorded and becomes available for viewing the next day
time
Flexible schedule
You can view recordings and study whenever and wherever you want
online
Online platform
You will become part of a community of students, and you will be able to exchange experiences and questions.
Register

Curator of the course

Ihor

Ihor Betley – Head of R&D in Platma & Agrosem

  • 10+ years of experience implementing BI, Data Science, and AI systems in business 
  •  22+ companies from the USA/Europe/Ukraine with a turnover of +$22 billion per year
  •  +20% – the average increase in the turnover of companies after the implementation of BI,
  • Data Science, and AI solutions without increasing the number of employees 
  •  The author of educational programs that have taught 700+ students
They write about Igor:
liga.net
mctoday
ain
agrosem
itc.ua
medium
dev.ua
platma

Registration for the course:

Enough of spending time on machine work and creating reports. Sign up for the Power BI course and learn the tool for convenient and effective data analysis!

Register

Frequently asked questions

Are you current with hands-on exercises from real-world Power BI usage scenarios?

Our course is based on practical exercises and real cases to maximize students’ understanding and skills.

Does the course price include all necessary materials and resources, or are there additional costs?

The price of the course includes all necessary materials and resources. There are no additional costs.

How many hours a week will I have to devote to studying?

The recommended study time is 8-10 hours per week. A flexible schedule allows you to choose a time that is convenient for you.

Will this course be challenging if I have never worked with Power BI?

The course is designed for all levels of training. Learning starts with the basics, so even beginners can learn the material quickly.

How to get an installment plan?

Find out more about installment options by contacting our customer service department using the contacts on our website.

Are you tired of spending time compiling reports and explaining to colleagues?

Learn how to create simple and clear reports for the whole team! Make time for what’s important. Register now and discover the efficiency and simplicity of data management!

Sign up for the Power BI A to Z course

contacts
Привіт 🤗
Маєте питання? Наша команда завжди готова вам допомогти! Задайте питання у будь-якому месенджері: