ua
Light
Dark
Отримати консультацію

Power BI secrets

How to make your schedules efficient and automate company processes
Master the tool for business analysis and creation of interactive reports. Conquer your data with Power BI!

Learn how to create graphs and dashboards in Power BI without the help of programmers.

monitor

Evaluate business metrics by accessing your company statistics.

brain

Build an end-to-end analysis system to solve business problems effectively.

cup

Delegate the processing of Power BI business data by streamlining the reporting system.

sepeacer

Learn how Power BI can effectively optimize and improve your business.

clock

Get expert advice from a business analyst with many years of experience.

medal

What shall we talk about?

Image
  1. What is Power BI? Why and who needs it?
  2. Power BI secrets

    how to create effective and understandable graphs

  3. Review of techniques and strategies for:

    improvement of visualization and informativeness of graphs

  4. From Ordinary to Impressive

    secrets of graphic design in Power BI

  5. Process automation

    How to Ensure the Smooth Flow of Business Processes in Power BI

  6. Creation of ready-made reports

    From analyzing and processing data to creating reports in Power BI

  7. Process management and forecasting

    Using Power BI for Effective Business Management

  8. Why Power BI is a must-have for:

    marketers, analysts, financiers, company managers

  9. How knowledge of Power BI affects:

    wage level and company profit

Our
lecture will be useful:

  • Marketers
    rocket

    Understand your customers’ needs through powerful graphs and data analysis. Create successful marketing strategies.

  • To the managers
    medal

    Optimize business processes and make informed decisions based on clear reports and analytics.

Learn how to turn large amounts of data into clear and attractive reports

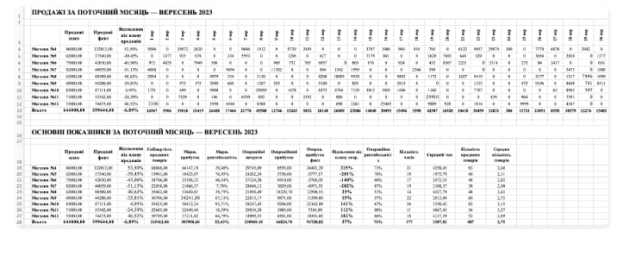
Report before the course

table

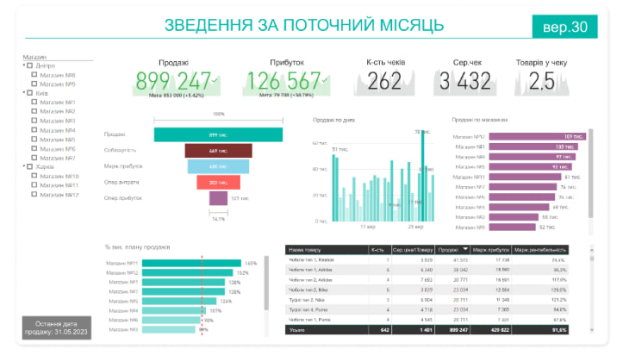
Report after the course

table

Speaker of the lecture

Ihor
Register

Igor Betley – Head of R&D in Platma & Agrosem

  • 10+ years of experience in implementing BI, Data Science, and AI systems in the business of
  • 22+ companies from the USA/Europe/Ukraine with a turnover of +$22 billion per year
  • +20% – the average increase in the turnover of companies after the implementation of BI, Data Science and AI solutions without increasing staff
  • The author of educational programs, which have been studied by 200+ students
About Igor:
liga
MCToday
ain
agrosem
ITC
Medium
dev
platma

Do not miss the opportunity to improve your skills.

On target

Use the opportunity tomake your business even more efficient and competitive! Register now!

Register for a Power BI lecture.

contacts
Привіт 🤗
Маєте питання? Наша команда завжди готова вам допомогти! Задайте питання у будь-якому месенджері: