ua
Light
Dark
Отримати консультацію

Data Wizard

data proection
Master 2 professions for the price of 1:
Data Scientist and Data Analyst from scratch
TOP in-demand profession, which will grow by 364% by the year 2025 according to forecasts of IBM
Ability to capture processes and make sound business decisions
Live master classes, mentor support, portfolio projects
Internship opportunity in the best IT companies with the Salary over $1000 from the start
Register
Start:
26.03.24
Format:
online
Duration:
4 months
data proection

Benefits of the course

work
In-demand job
According to Venngage, 91% of marketers consider data analytics as cruicial link for the market success. The demand for such experts increases yearly, because the world is extremely dependent on Data tools.
AI not take your place
AI will not take your place
According to forecasts, artificial intelligence could replace 52% of jobs by 2025. So instead of being afraid to be covered by AIy AI, learn to use AI to benefit from it!
HR training
HR training
Our HR experts will help you to prepare for job opportunities, interviews, meetings, and teamwork.
IT-English
IT-English
You will also get free access to an English classes designed for IT professionals. We will teach you all the terms necessary for your work.
Employment with partners
Our partners are highly interested in promising course graduates. The best graduates get job offers immediately after the course.
Specific Skills
Specific Skills
We guarantee that you will learn to foresee future processes and make strategic decisions based on data

Our course will work:

Student
rocket
For beginners
wishing to master Data Science skills
programmer
code
For programmers (Python|QA)
planning to perform analytics using Python, improve data understanding, and quality of testing (QA)
For marketers
Megaphone
For marketers
wishing to use data to define their target audience, optimize campaigns, and increase marketing effectiveness
analysts
ChartBar
For rising analysts
aiming to automate information gathering, create and train models, make forecasts, and solve business issues
For sociologists
Magnifying Glass
For sociologists
seeking to analyze sociological data and draw conclusions from research effectively
For managers and financiers
Brief case
For managers and financiers
striving to learn processes of data gathering and analyses to enhance management decisions and financial strategy

Course program

This program is designed in easy and understandable way. It is based on direct benefits for work and contains many life hacks and real-life examples.
Module 1
Introduction/Acquaintance/ Immersion
hand
Introduction/Acquaintance/ Immersion
Module 1
Understanding the basics of data analysis:
Students will learn what data is vital to a business and how its analysis can lead to decisions empowering business processes.
Module 2
SQL
sql
SQL
Module 2
Extracting the necessary information:
Students will learn to use SQL to extract specific data from databases for problem-solving, such as analyzing sales or tracking product inventory.
Query optimization:
Knowledge of SQL will allow students to improve the performance of their queries and reduce execution time.
Module 3
Power BI
power Bi
Power BI
Module 3
Creation of reports and dashboards:
Students will learn to create reports and dashboards in Power BI to render data. For example, creating sales reports or reports on the financial status of the company.
Monitoring of key indicators:
Use Power BI to monitor key performance indicators and respond to business changes promptly.
Module 4
Basic Python
python
Basic Python
Module 4
Data processing and analysis
Students will learn to use Python for data science, such as removing duplicates from data sets or calculating statistics.
Development of reports and scripts
Students will learn to develop automated reports and scripts for routine tasks, which helps save time
Module 5
Python and Data
python
Python and Data
Module 5
Retriving data from web services
Students will learn to use the API to retrieve data from web services, such as weather data or financial indicators.
Processing and analysis of large data volumes
Students will learn to use the NumPy and Pandas libraries to process and analyze large amounts of data efficiently.
Module 6
Math for Data Science
Data Science
Math for Data Science
Module 6
Development of mathematical models
Students will learn to develop mathematical models for forecasting and optimization, such as sales forecast models or inventory optimization models.
Analysis of statistical data
Students will learn to use statistical methods to analyze data and identify relationships between variables.
Module 7
Machine Learning
Machine Learning
Machine Learning
Module 7
Development of forecasting models
Students will learn to create machine learning models for forecasting, such as forecasting of product demand or classifying of customer requests
Evaluation and selection of models
Students will learn to evaluate the effectiveness of models and select the best ones for specific tasks.
Using Neural Networks
Students will learn to use neural networks for data analysis and processing, such as pattern recognition or text analysis.
hand
Introduction/Acquaintance/ Immersion
Module 1
Understanding the basics of data analysis:
Students will learn what data is vital to a business and how its analysis can lead to decisions empowering business processes.
Every point helps students develop practical skills and capabilities that can be used in various fields such as business analytics, scientific research, finance, and others.
sql
SQL
Module 2
Extracting the necessary information:
Students will learn to use SQL to extract specific data from databases for problem-solving, such as analyzing sales or tracking product inventory.
Query optimization:
Knowledge of SQL will allow students to improve the performance of their queries and reduce execution time.
Every point helps students develop practical skills and capabilities that can be used in various fields such as business analytics, scientific research, finance, and others.
power Bi
Power BI
Module 3
Creation of reports and dashboards:
Students will learn to create reports and dashboards in Power BI to render data. For example, creating sales reports or reports on the financial status of the company.
Monitoring of key indicators:
Use Power BI to monitor key performance indicators and respond to business changes promptly.
Every point helps students develop practical skills and capabilities that can be used in various fields such as business analytics, scientific research, finance, and others.
python
Basic Python
Module 4
Data processing and analysis
Students will learn to use Python for data science, such as removing duplicates from data sets or calculating statistics.
Development of reports and scripts
Students will learn to develop automated reports and scripts for routine tasks, which helps save time
Every point helps students develop practical skills and capabilities that can be used in various fields such as business analytics, scientific research, finance, and others.
python
Python and Data
Module 5
Retriving data from web services
Students will learn to use the API to retrieve data from web services, such as weather data or financial indicators.
Processing and analysis of large data volumes
Students will learn to use the NumPy and Pandas libraries to process and analyze large amounts of data efficiently.
Every point helps students develop practical skills and capabilities that can be used in various fields such as business analytics, scientific research, finance, and others..
Data Science
Math for Data Science
Module 6
Development of mathematical models
Students will learn to develop mathematical models for forecasting and optimization, such as sales forecast models or inventory optimization models.
Analysis of statistical data
Students will learn to use statistical methods to analyze data and identify relationships between variables.
Every point helps students develop practical skills and capabilities that can be used in various fields such as business analytics, scientific research, finance, and others.
Machine Learning
Machine Learning
Module 7
Development of forecasting models
Students will learn to create machine learning models for forecasting, such as forecasting of product demand or classifying of customer requests
Evaluation and selection of models
Students will learn to evaluate the effectiveness of models and select the best ones for specific tasks.
Using Neural Networks
Students will learn to use neural networks for data analysis and processing, such as pattern recognition or text analysis.
Every point helps students develop practical skills and capabilities that can be used in various fields such as business analytics, scientific research, finance, and others.

How is your training orginized?

Wi-fi
Online forma
Every lesson takes place online on the platform using samples of real-cases
practice
Emphasis on practice
The Data Wizard course is focused on practical training and interaction with experienced mentors
mentor
Professional mentors
Only interesting studies from people with a comprehensive background who know their area and are ready to help.
learning
video
Classes recording
Every lesson is recorded. It becomes available for viewing on the next day.
time
Flexible schedule
You can view classes records and study from any location at any time.
online
Online platform
You will become part of a community of students with opportunity to exchange experiences and questions.

Your path on the Data Wizard course

training
01
Gaining access to training
Taking courses on the platform
02
Taking courses on the platform
Consultation
03
Consultation from Igor – course mentor
Master
04
Master new profession just in 3 months.
HR section
05
Gaining access to the HR section
resume
06
Improving your CV and social media profiles
final
07
Completion of Part 2 of training and mastering the Data Science profession
Exam
08
Exam
promotion
9
Update your CV, get a promotion, or move to a new company with higher salary
references from our partners
10
Get included in references from our partners

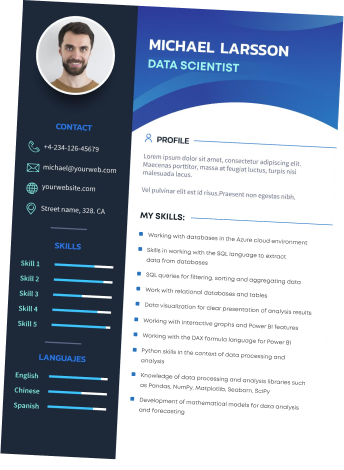
Your CV

Do you want to be as successful as Netflix or Amazon? Start your career in DATA! An exciting and in-demand profession awaits you, and employers strive to pay high rates.
Tools:
Python
Python
Jupyter Notebook
Jupyter Notebook
Pandas
Pandas
SQL
Power BI
Power BI
Numpy
Skills you will receive:
  • Experience with databases in the Azure cloud environment
  • Skills in working with SQL language to extract data from databases
  • SQL queries for filtering, sorting and aggregating data
  • Experience with relational databases and tables
  • Data visualization for accurate presentation of analysis results
  • Experience with interactive charts and Power BI features
  • Experience with the DAX formula language for Power BI
  • Experience with Python in terms of data science
  • Proficiency in data processing and data analysis libraries such as Pandas, NumPy, Matplotlib, Seaborn, SciPy
  • Experience in development of mathematical models for data analysis and forecasting
resume

Your salary after courses

$700+
Data Analyst
Data Analyst
$1000+
Data Scientist
Data Scientist
$1500+
Middle Data Scientist
$4000+
Senior Data Scientist

Income you can claim upon completion of your classes.

You will need the basic knowledge for everyday tasks.

You should get a salary increase as your skills and experience grow.

You need to master the following areas:

You should get a salary increase as your skills and experience grow..

You need to master the following areas:

At the highest level, your Data Science career can reach new heights.

To become a Senior Specialist, you need:

Programming Basics (Python)
Mathematical and statistical basics
Data processing and analysis (NumPy, Pandas, Matplotlib)
Machine learning (regression, classification, clustering)
Improvement of your programming (Python) and library knowledge
Solid knowledge of statistical methods and their application in data analysis
Study of more complex machine learning algorithms and their practical use
Improvement of your programming (Python) and library knowledge
Solid knowledge of statistical methods and their application in data analysis
Solid knowledge in programming, including working with large volumes of data and code optimization
Expertise in developing and tuning complex machine learning models
Expertise in selecting and combining different algorithms to achieve the best results

Your CV will be sent to our partners!

They will help you create or improve your LinkedIn page, explain how to behave during interviews, and what criteria to follow, making your choice about a superior workplace.
Join Platma Academy and discover a world of unlimited opportunities and career prospects!
Register

Course Author

Igor Betley

Igor Betley – Head of R&D in Platma & Agrosem

  • 10+ years of experience in implementing BI, Data Science, and AI systems in business.
  • 22+ companies from the USA/Europe/Ukraine with a turnover of +$22 billion annualy.
  • +20% – average increase in a company turnover after implementation of BI, Data Science, and AI solutions without increasing the workforce.
  • Author of educational programs that have taught 700+ students.
Feedback about Igor:
liga.net
mctoday
ain
agrosem
itc.ua
medium
dev.ua
platma

Course Mentors

Samoilenko Vladislav

Samoilenko Vladislav

  • Data Wizard Course Mentor
  • Proficient in technologies: Power BI, Excel, Tableau, SQL, Python, Power Query, and Machine Learning.
  • More than two years of practice:
    • Data Analyst at DataOX: Performed analysis of large volumes of data, identified patterns, and developed reports to support strategic decisions.
    • Data Annotator at SupportYourApp: Performed data processing and annotation to train artificial intelligence algorithms.
    • SupportYourApp: Worked on critical data science projects to improve customer support algorithms.
Denis Sokotov

Denis Sokotov

  • Data Wizard Course Mentor
  • Proficient in technologies: Azure Data Studio, Jupyter, Power BI, Excel, SQL, Python, Power Query, Machine Learning.
  • Over three years of practical experience in the field of data analytics:
    • International outsourcing company: created reports and dashboards of various levels and types. From reports on internal resources to comprehensive hiring process dashboards.
    • Created the dashboard “Digital Analysis of Activities of Universities,” which won the international competition “DigIn.Net 2: German-Ukrainian Digital Innovation Network – 2.”
    • Developed a dashboard for the Power BI Analytics Challenge, which reached the finals. (9 finalists, 419 participants).

FAQ

Is this course suitable for me if I am a humanities major?

Certainly! This course is for everyone, regardless of your professional background. We explain everything from scratch.

Is this course suitable for me if I need to improve in math?

Nowadays, Low/No-code tools don’t require deep mathematical knowledge, like programming knowledge, in the IT area. The main thing is to have a clear idea about the purposes of gained knowledge of data analysis in terms of your business processes, as well as about potential applications in practice.

Is this course suitable for me if my level of English could be stronger?

The course is available in Ukrainian, and English is optional. Moreover, this course includes IT English classes to improve your English. We will communicate to you all the terms necessary for your work.

How to get an installment plan?

Please find out more about installment plans by contacting our customer service department using the contact details on our website.

Why didn't you include Tableau in the course program?

Our Data Wizard course focuses on various skills in the field of data analysis and data science. Although Tableau is a powerful visualization tool, we decided to concentrate on studying other aspects, such as SQL, Power BI, Python, Data Science, and Machine Learning, to provide deeper knowledge in the chosen field.

Why did you choose Python as the programming language for the course, and not R?

We chose Python for its versatility and wide range of applications in various industries, such as web development and artificial intelligence. Our course is designed to provide students with skills that can be used in different areas of professional activity. Python was chosen for its broad capabilities and good career prospects for our students.

Tired of wasting time on reports and explaining to colleagues?

Learn how to create simple and clear reports for the whole team! Make time for what’s really important. Register now and discover the efficiency and simplicity of data management!

Registration for the Data Wizard course

contacts
Привіт 🤗
Маєте питання? Наша команда завжди готова вам допомогти! Задайте питання у будь-якому месенджері: